Turn your spreadsheets into explorable charts
Visualize your data with our charts & summaries and discover trends and correlations.
Data evaluation made to fit
With Dataflexor you can load data, transform it, combine different data sources, get an overview of it and finally analyze interesting aspects in detail.
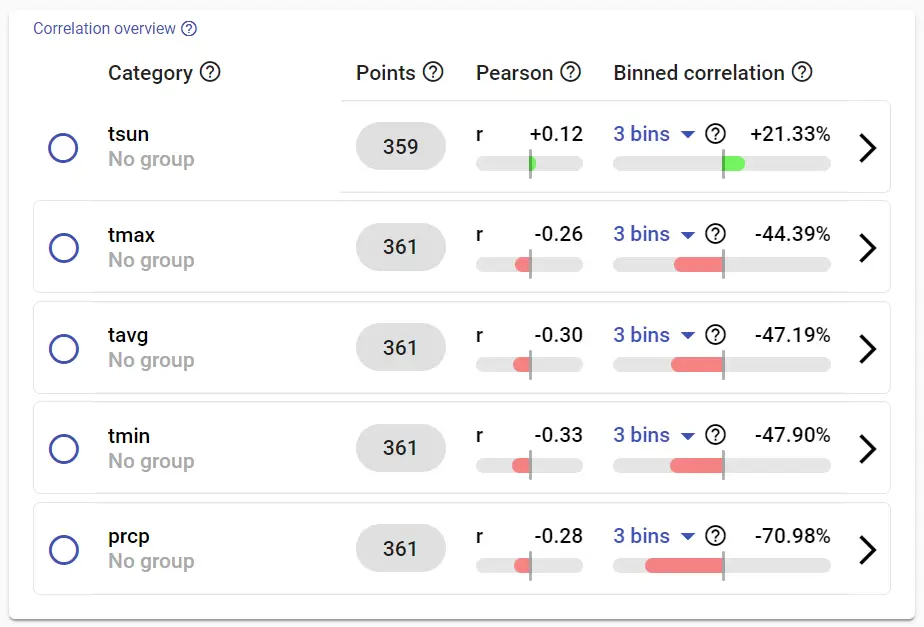
Visualize correlations
Would you just like to see where correlations might be found instead of having to specifically look for them? Dataflexor offers you a convenient overview so that you can identify possible correlations at a glance.
Detect possible correlations with ease
Display of how meaningful a data set is
Filter options for precise evaluations

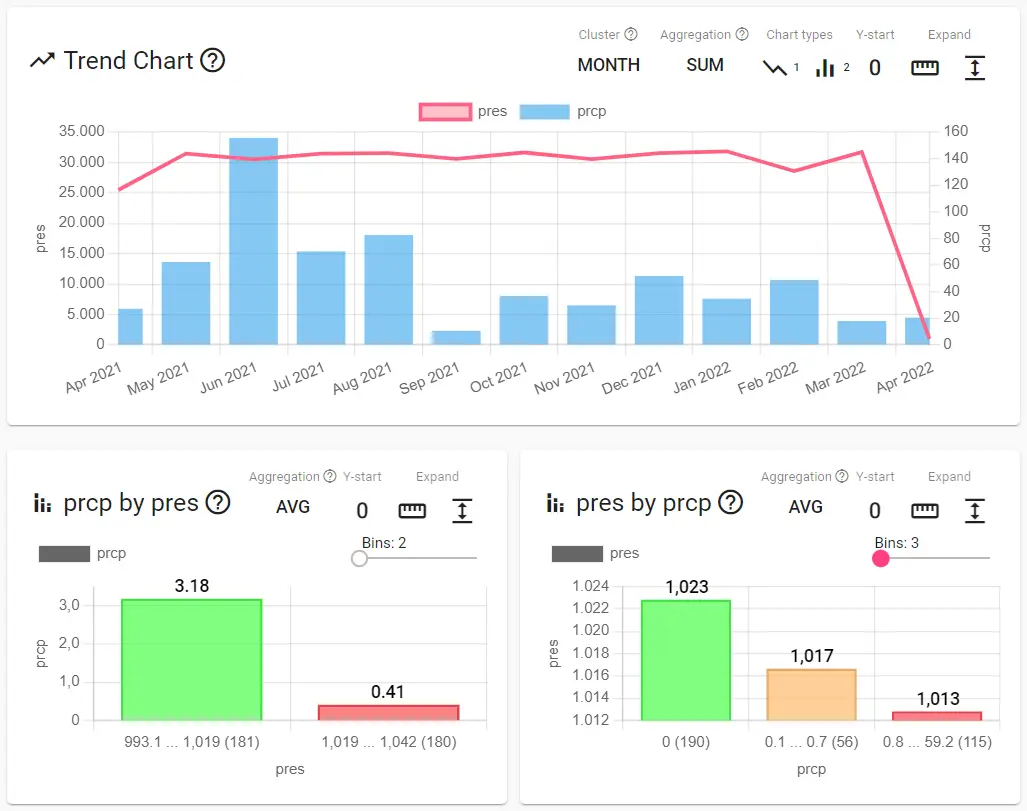
Evaluate with charts
Of course, Dataflexor also allows you to take a detailed look at your data. Key figures, diagrams and other options for precise evaluation are waiting for you.
Examine possible correlations in detail
Useful trend overview
Make even delayed effects visible

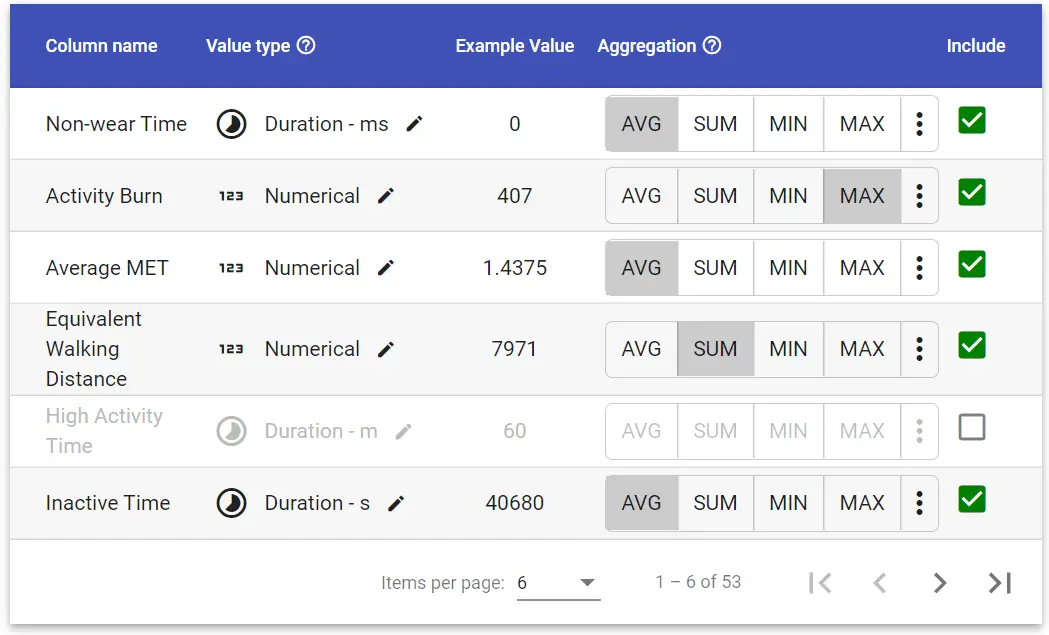
Transform your data
Data comes in a wide variety of formats and forms. You still only need one evaluation tool, because with Dataflexor you can transform your data into the right format before evaluation.
Ready-made and custom templates
Automatic data transformation
Numerous detailed transformation settings possible

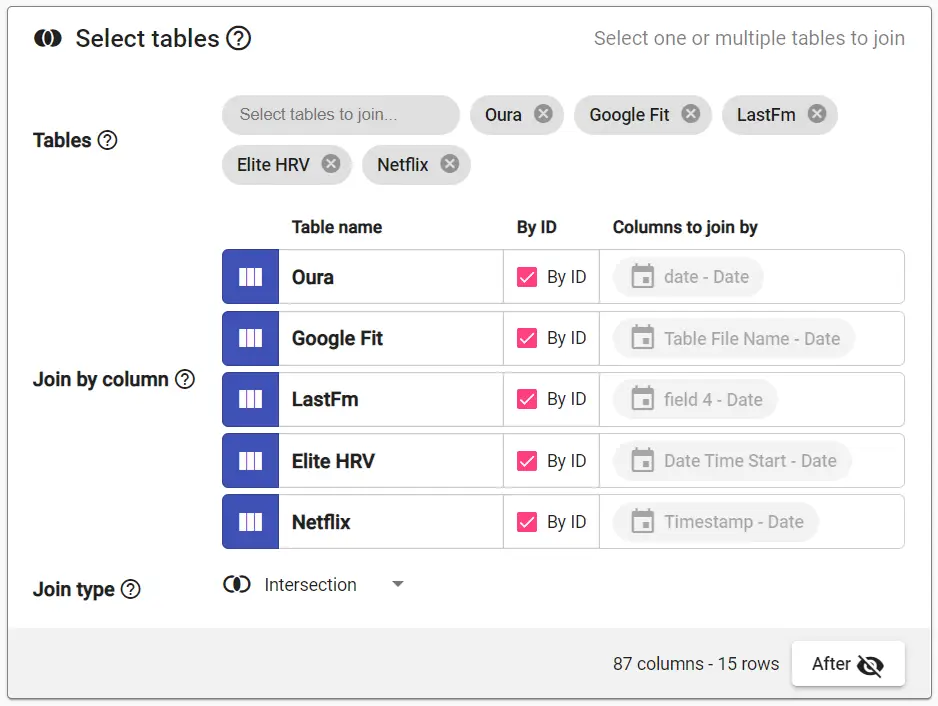
Combine data sources
Do you have data that you would like to evaluate together, but which is saved in different files? No problem, Dataflexor offers you the possibility to join different data sources for a common evaluation.
Join two or more tables
Combine columns of various tables

Ready to start diving into your data?
Don't miss out on valuable data insights.
